What is a vitamin?
A vitamin is an organic compound or group of related compounds that an animal's body needs in order to live, but which the animal cannot make on its own in sufficient quantities to satisfy that need.
Vitamin C is ascorbic acid. Our bodies need it for important enzyme reactions, including wound healing. Vitamin C deficiency causes the disease Scurvy, where sufferers bruise easily (because blood vessels are weak and don't heal well), get loose teeth (because connective tissue weakens), amongst other symptoms.
Most animals can make ascorbic acid in their own bodies, so it's not a vitamin for them. Dogs and cats don't need supplemental ascorbic acid in their diets. We talked about why this might be, discussing the natural diet of different animals. The few animals which need ascorbic acid in their diets (ie the ones who need vitamin C) include some primates (humans, apes and monkeys), guinea pigs, most bats, some fish and some birds.
Our bodies can't store vitamin C, so we need to get it from our diet every day. Any excess is passed out in urine. For this practical, we measured the amount of vitamin C in some urine samples from our group, and compared them to the average.
Now let's translate our activity title to everyday English:
We performed a quantitative assay of vitamin C in urine specimens using iodometric titration.
An "assay" is an analysis (test) in biology to establish information about a target substance.
A "qualitative" analysis, or assay, aims to tell you what's in a substance .
A "quantitative" analysis aims to find out how much of the target substance is in a sample.
So a "quantitative assay" means a way of measuring how much vitamin C there was in urine specimens.
A "titration" is used to measure the volume of one solution which reacts exactly with another solution. It's pronounced "tie - tration".
"iodometric titration" means a titration using iodine.
Titrations - Background
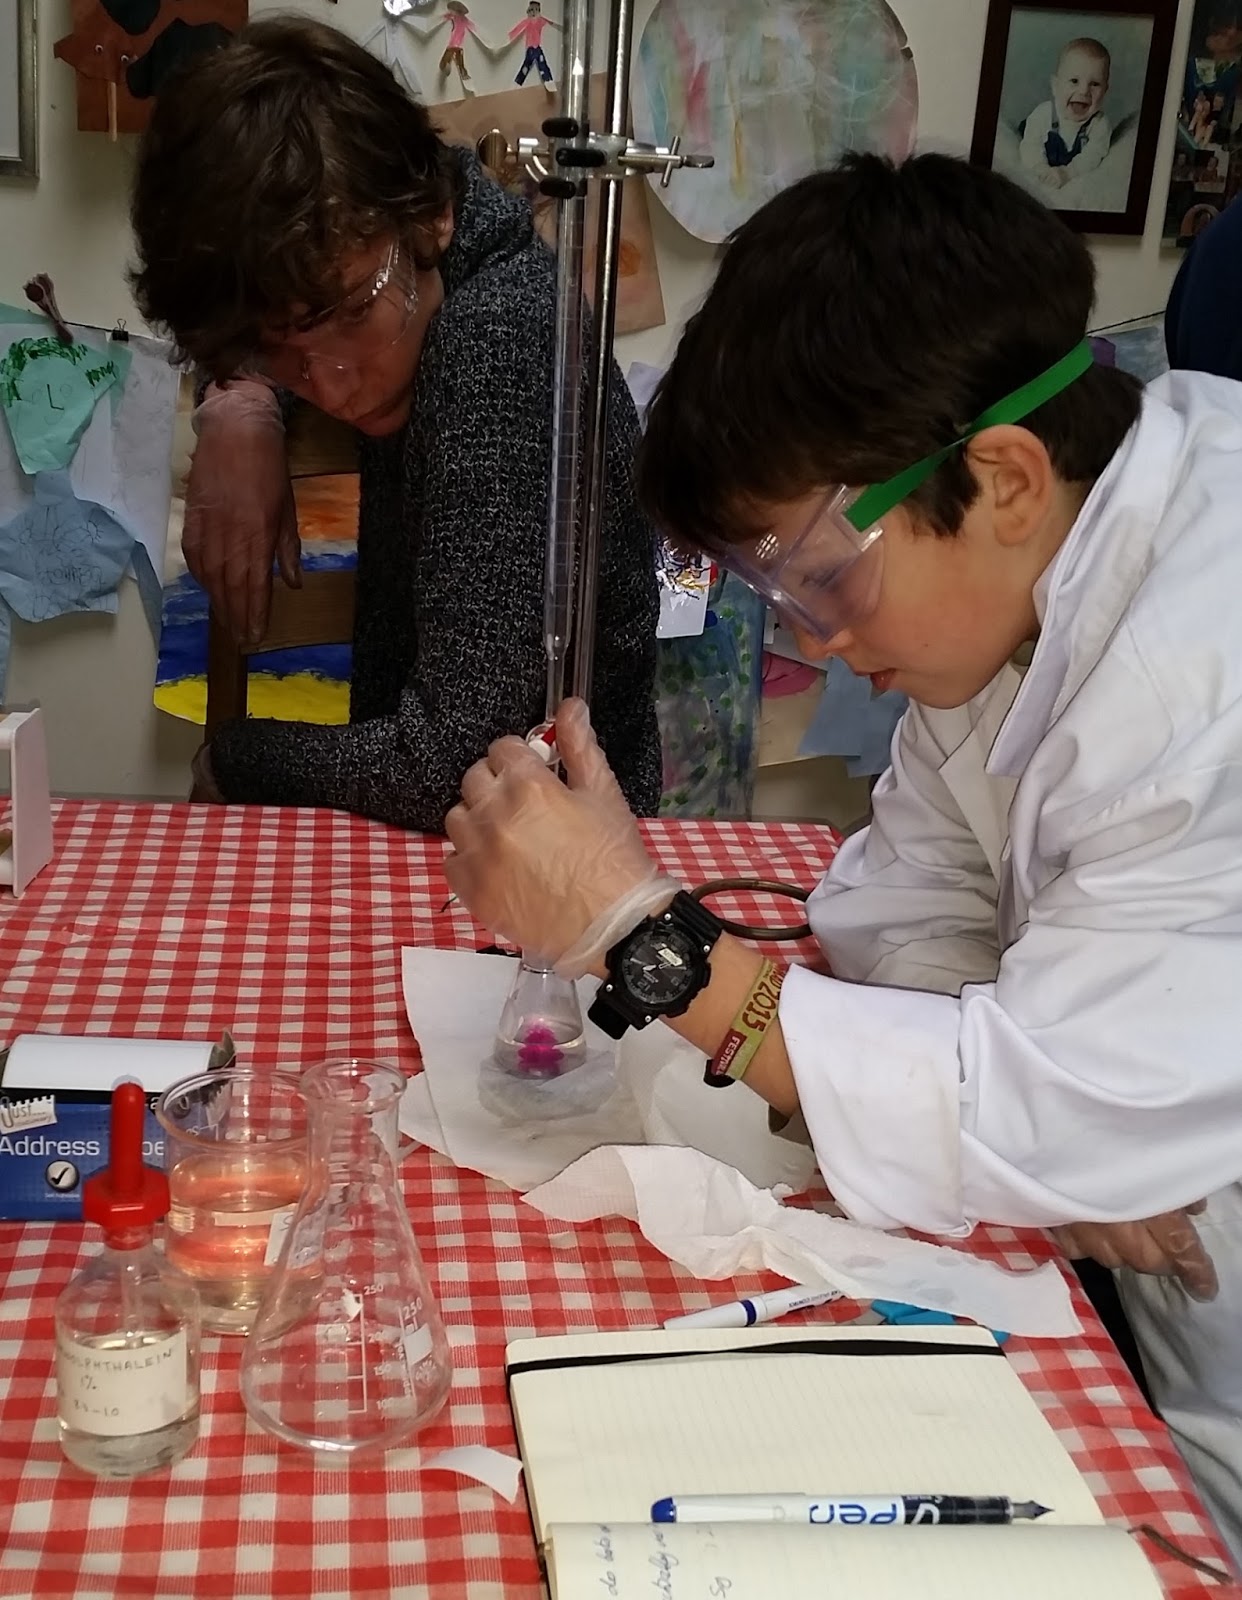
First, Angie demonstrated an acid-base titration to revise work that most of us had done before. In an acid-base titration, we find out how much of an acid is needed to neutralise a base (alkali), using an indicator to show when the end point is reached. In this case, a solution of ascorbic acid was added to dilute sodium hydroxide, with phenolphthalein (pronounced, more or less, "feenol- thar- lean") indicator. This indicator is colourless for solutions up to pH 8.3, then turns pink as the solution grows more alkaline. First we tried having the alkali in the flask and the acid in the burette. The alkali started off pink and we added drops of acid until it turned colourless. It was difficult to find the end point this way as it was hard to judge when the solution really was colourless, as opposed to pale pink. Next we switched it around and had the acid solution in the flask, and added drops of alkali from the burette. This worked much better as you could see a splash of pink in the flask when alkali was added.
 |
| A pink colour appears where the alkali from the burette hits the acid in the flask. |
We carried adding drops of alkali and swirling the flask, until the pink colour no longer disappeared on swirling. This gave us our end point.
 |
| The solution remains pink after swirling, so the end point is reached. |
We moved on to our main activity:
Assaying Vitamin C Concentration in Urine
This activity was taken fromIllustrated Guide to Home Biology Experiments: All Lab, No Lecture
By Robert Thompson, Barbara Fritchman ThompsonThe authors have generously made the whole book available freely online. Their instructions assume you are carrying out the activity with Vitamin C tablets rather than powder.
Supplies
For the main practical, we used the following:Consumables:
- Iodine solution (dilute)
- Starch solution (water left over from cooking pasta, rice or potatoes)
- Vitamin C powder, from a health food shop (you can also use a vitamin C soluble tablet)
- Distilled water
- Urine!
Equipment:
- Measuring cylinders - 10ml and 100ml
- Beaker
- Test tubes
- Test tube rack
- Pipettes (several, to avoid contaminating solutions)
- Balance
If you want to try this activity at home, you can manage without the balance by using a vitamin C tablet which contains a measured quantity of vitamin C and (hopefully) not too much other stuff. The only essentials are iodine solution (you can buy this online if your local pharmacy doesn't have any - doesn't really matter which concentration), some pipettes or tiny syringes (eg insulin syringes, which dispense in fractions of a ml), and a way of measuring larger volumes of liquids precisely. Plastic measuring cylinders and pipettes are very cheap to buy online, but you could also use plastic syringes to accurately measure the 10ml volume, and a small measuring jug to measure 100ml volume. The most important thing is to use pipettes carefully to count drops.
You'll also need urine, of course....
Method
For the vitamin C titration, we used iodine. Vitamin C reacts quickly with brown iodine, producing iodide ions, which are colourless. We tested this by making a standard vitamin C solution, measuring 0.50 g of vitamin C powder and making up a solution.
 |
| Measuring 0.50g Vitamin C |
Once we had our precise amount of vitamin C, we added it to 50ml of distilled water in a beaker, then poured that into a large measuring cylinder. We rinsed out the beaker with more distilled water, adding that to the measuring cylinder, and topping up to 100ml. This is called a quantitative transfer - it ensured that all of the vitamin C made it into the measuring cylinder, rather than leaving any stuck to the wall of the beaker. We stirred carefully at every stage.

This gave us a solution of 0.50g Vitamin C per 100ml. We wanted to get to 0.50g per litre, which is roughly the average content of human urine. This required us to dilute our solution further. We carefully measured 10ml from our solution using a measuring cylinder. We rinsed out our 100ml measuring cylinders, and put 10ml of the concentrated solution into them. We topped this up to 100ml again. You can see from the photos that there was some really careful measuring going on. We read the measurement on the cylinder from the bottom of the meniscus (curve on the top of the solution).


Finally, we had our reference solution - 0.50g vitamin C per litre. We placed this in a specimen tube with a tight-fitting cap, to prevent the vitamin C content being affected by contact with the air.
Next, we made up a dilute iodine solution. We put 2mls of distilled water in each of two test tubes. 10 drops of iodine solution were added to each. The liquid in each test tube was pale brown.

Now the titration began. We added our standard vitamin C solution to one test tube, drop by drop. We wanted to see how many drops it took for the brown colour to nearly disappear from the iodine solution. We used the control tube to compare colours.


Once we were near the end point, we needed to make it easier to see precisely when all the brown iodine had been reacted to make colourless iodide ions. We used the iodine-starch reaction, where iodine and starch make a blue-black colour together. When it looked like nearly all the iodine in the test tube had reacted, we added just two drops of starch solution, and swirled. Immediately, the solution in the test tube turned inky blue. Now, we added one more drop of vitamin C solution,and swirled. If any blue colour remained, we added more vitamin C, counting drops carefully, until the end point was reached. We found that a trace of blue colour always remained, so when we thought we'd probably reached the end-point, we made a note of how many drops had been used, then added one more and checked if the colour changed. If not, we used the first reading.


Two groups found that 4 drops of the standard vitamin C solution was required to neutralise the iodine. The third group had a different batch of iodine solution and in their case, 7 drops of vitamin C solution were required to neutralise the iodine solution.
Next came the bit that everybody had been waiting for - the urine samples! One student had been given a high-dose vitamin C supplement at the start of the session, while another unfortunate student's parent had attempted to deprive him of vitamin C for 24 hours beforehand. Several students were keen to volunteer their samples. The students involved will remain nameless!

We repeated the titration that we'd done with the vitamin C solution, but this time using urine. We counted how many drops of urine it took to react precisely with the same amount of iodine, and compared that to our results for the vitamin C solution. In two cases, the urine contained the same concentration of vitamin C as our standard solution - so it took the same number of drops to neutralise the solution. Remember that our standard solution was made up to have a similar vitamin C concentration to the average person's urine.

 |
| Shake well at every stage - but don't forget to cap the tube with your thumb! |

One anonymous student had taken a high-dose vitamin C supplement at the start of the session. While it took 4 drops of vitamin C solution to reach the end-point of our titration, it only took one drop of his urine. So, his urine contained four times as much vitamin C as the standard solution. On the other hand, the poor student who'd been deprived of foods rich in vitamin C for the past day did not fare so well. It took five drops of his urine, compared to four for the standard solution. Still not a bad result!

One mystery student had high levels of vitamin C in her urine - almost twice the concentration of the standard solution. On questioning, we found that she'd eaten fresh fruit for breakfast.

Finally, we tested the urine samples for protein, as we had some testing strips available. We discussed how to read the test, and how trace readings could indicate contamination, but higher readings of protein in the urine could indicate an infection.


